Guest Post: Real-time IoT monitoring with NATS JetStream, RisingWave, and Superset
Fahad Shah — February 29, 2024
In the realm of IoT, real-time data processing presents specific challenges, including limited edge computing resources, network constraints, scalability considerations, and device diversity. Overcoming these obstacles requires the application of efficient edge computing techniques, robust security measures, standardized protocols, scalable management systems, and advanced data processing capabilities.
By combining the strengths of NATS JetStream, RisingWave, and Superset, a powerful solution emerges for the development of reliable and scalable real-time IoT applications. This solution leverages NATS JetStream’s efficient messaging capabilities, RisingWave’s secure and adaptable infrastructure, and Superset’s advanced data visualization and analytics features. Together, these tools create a cohesive ecosystem that empowers developers to confidently and efficiently address the complexities of real-time IoT data processing.
What is RisingWave?
RisingWave RisingWave is a distributed SQL streaming database that enables simple, efficient, and reliable processing of streaming data. It’s easy to set up, use, and operate.
What is NATS JetStream?
NATS is a secure connectivity technology designed for discovering and exchanging messages in distributed systems. It can be deployed in any environment for different use cases such as microservices, data streaming, and IoT, supporting edge devices with a large number of languages and clients for interaction. JetStream is a built-in distributed persistence engine for NATS. It enables new functionalities and higher qualities of service on top of the base ‘Core NATS’ functionalities and qualities of service.
What is Superset?
Apache Superset is a modern data exploration and data visualization platform. It is an open-source software that can replace or augment proprietary business intelligence tools for many teams.
Overview
In this blog, we will delve into an IoT scenario where we focus on monitoring temperature and humidity data from IoT sensors. We will explore how NATS JetStream empowers edge devices to effortlessly transmit data streams to RisingWave for real-time processing. By employing window operations and aggregations, RisingWave efficiently performs advanced analytics on the data. Finally, we showcase the visualization of the processed and analyzed data using tables, charts, and an integrated dashboard powered by Superset.
1. Set up NATS JetStream
The NATS Server is highly optimized, featuring a compact binary of less than 20 MB. This enables it to run effortlessly on a spectrum of machines, ranging from a Raspberry Pi to the largest of servers, whether in the cloud, on-premise, at the edge, on bare metal, on VMs, or in containers.
You can install NATS JetStream using Docker, as follows:
docker pull nats:latest
To run NATS JetStream on Docker, you can start the NATS server with the -js flag. This flag enables the JetStream feature and allows you to leverage its capabilities.
docker run -p 4222:4222 -ti nats:latest -js
It starts NATS JetStream. Now you can publish and subscribe to messages via a variety of languages and clients.
NATS JetStream server running at port 4222.
2. Publish data to JetStream
In this example, we publish IoT data to JetStream’s stream named event_stream using the iot_data subject. Here is a sample of the data being published:
'{"device_Id":"sensor1","temperature":25,"ts":"2023-01-05 05:50:00+00:00"},
'{"device_Id":"sensor1","temperature":26,"ts":"2023-01-05 05:50:01+00:00"}'
'{"device_Id":"sensor2","humidity":60,"ts":"2023-01-05 05:50:01+00:00"}'
'{"device_Id":"sensor1","temperature":27,"ts":"2023-01-05 05:50:02+00:00"}'
'{"device_Id":"sensor2","humidity":62,"ts":"2023-01-05 05:50:02+00:00"}'
3. Ingest data from JetStream into RisingWave
We can use the open-source RisingWave or the managed service, RisingWave Cloud, for ingesting and processing streaming data. In this blog, we’ll use RisingWave Cloud, which offers a user-friendly experience and simplifies the operational aspects of managing and utilizing RisingWave for our IoT monitoring solution.
Create a RisingWave cluster
Create a RisingWave cluster in RisingWave Cloud using the developer tier. See the documentation of RisingWave Cloud for instructions.
Create a table in RisingWave to ingest data streams
Now create a table in RisingWave to ingest data from the stream named event_stream in the iot_data subject that was set up earlier. In this example, RisingWave acts as the subscriber to the NATS JetStream stream and subject.
Please note that a table with connector settings in RisingWave can ingest unbounded event stream data.
CREATE TABLE iot_table(
  device_Id VARCHAR,
  temperature VARCHAR,
  humidity VARCHAR,
  ts TIMESTAMPTZ
)
WITH (
  connector='nats',
  server_url='nats://8.210.9.253:4222',
  subject='iot_data',
  stream='event_stream',
  connect_mode='plain'
)FORMAT PLAIN ENCODE JSON;
4. Perform analysis in RisingWave
We can filter the data for sensor1 with the following SQL statement.
SELECT
    device_Id,
    temperature,
    ts
from iot_table
WHERE deviceId ='sensor1'
limit 5;
Here is an example result.
device_id  | temperature |               ts
----------+-------------+-------------------------------
 sensor1  |          25 | 2023-01-05 05:50:00+00:00
 sensor1  |          26 | 2023-01-05 05:50:01+00:00
 sensor1  |          27 | 2023-01-05 05:50:03+00:00
 sensor1  |          28 | 2023-01-05 05:50:05+00:00
 sensor1  |          29 | 2023-01-05 05:50:07+00:00
We can filter the data for sensor2 with the following SQL statement.
SELECT
    device_Id,
    humidity,
    ts
from iot_table
WHERE deviceId ='sensor2'
limit 5;
| device_id | humidity |                    ts
|----------|----------|------------------------------------------
| sensor2  |    60    | 2023-01-05 05:50:02+00:00
| sensor2  |    62    | 2023-01-05 05:50:04+00:00
| sensor2  |    65    | 2023-01-05 05:50:06+00:00
| sensor2  |    68    | 2023-01-05 05:50:08+00:00
| sensor2  |    70    | 2023-01-05 05:50:10+00:00
The statement below creates a materialized view named avg_temperature_mv to calculate the average temperature for the specified device, sensor1, within 1-minute tumbling windows based on the timestamp, ts. The result includes columns for device ID, average temperature, window start, and window end.
CREATE MATERIALIZED VIEW avg_temperature_mv AS
SELECT device_Id, AVG(temperature) AS avg_temperature
window_start, window_end
FROM TUMBLE (iot_table, ts, INTERVAL '1 MINUTES')
WHERE device_Id ='sensor1'
GROUP BY device_Id,window_start, window_end;
We can query the results with the following SQL statement.
SELECT * FROM avg_temperature_mv LIMIT 5;
Here is an example result.
| device_id | avg_temperature  |        window_start        |          window_end
|----------|------------------|----------------------------|--------------------------
| sensor1  |        41        | 2023-01-05T05:56:00Z       | 2023-01-05T05:57:00Z
| sensor1  |        40        | 2023-01-05T05:50:00Z       | 2023-01-05T05:51:00Z
| sensor1  |        38        | 2023-01-05T05:55:00Z       | 2023-01-05T05:56:00Z
| sensor1  |        35        | 2023-01-05T05:54:00Z       | 2023-01-05T05:55:00Z
| sensor1  |        55        | 2023-01-05T06:01:00Z       | 2023-01-05T06:02:00Z
Similarly, the statement below creates a materialized view named avg_humidity_mv to calculate the average humidity for the specified device, sensor2, within 1-minute tumbling windows based on the timestamp field, ts. The result includes columns for device ID, average humidity, window start, and window end.
CREATE MATERIALIZED VIEW avg_humidity_mv AS
SELECT device_Id, AVG(humidity) AS avg_humidity
window_start, window_end
FROM TUMBLE (iot_table, ts, INTERVAL '1 MINUTES')
WHERE device_Id ='sensor2'
GROUP BY device_Id,window_start, window_end;
We can query the results with the following SQL statement.
SELECT * FROM avg_humidity_mv LIMIT 5;
Here is an example result.
| device_Id | avg_humidity |        window_start         |          window_end
|----------|--------------|-----------------------------|-------------------------------
| sensor2  |   112.33     | 2023-01-05T05:58:00Z | 2023-01-05T05:59:00Z |
| sensor2  |      75      | 2023-01-05T05:53:00Z | 2023-01-05T05:54:00Z |
| sensor2  |      90      | 2023-01-05T05:55:00Z | 2023-01-05T05:56:00Z |
| sensor2  |      95      | 2023-01-05T05:50:00Z | 2023-01-05T05:51:00Z |
| sensor2  |     105      | 2023-01-05T05:57:00Z | 2023-01-05T05:58:00Z |
5. Visualize the data in Apache Superset
We’ll configure Superset to read data from RisingWave and build visualizations.
Connect RisingWave to Superset
You can use RisingWave as a data source in Apache Superset for creating visualizations and dashboards using the tables and materialized views in RisingWave. To understand the process, follow the instructions in Configure Superset to read data from RisingWave .
After successfully connecting RisingWave to Apache Superset, we add the materialized views in RisingWave as datasets to create tables, various charts, and a unified dashboard.
Visualize data with Apache Superset: table, charts, and dashboard
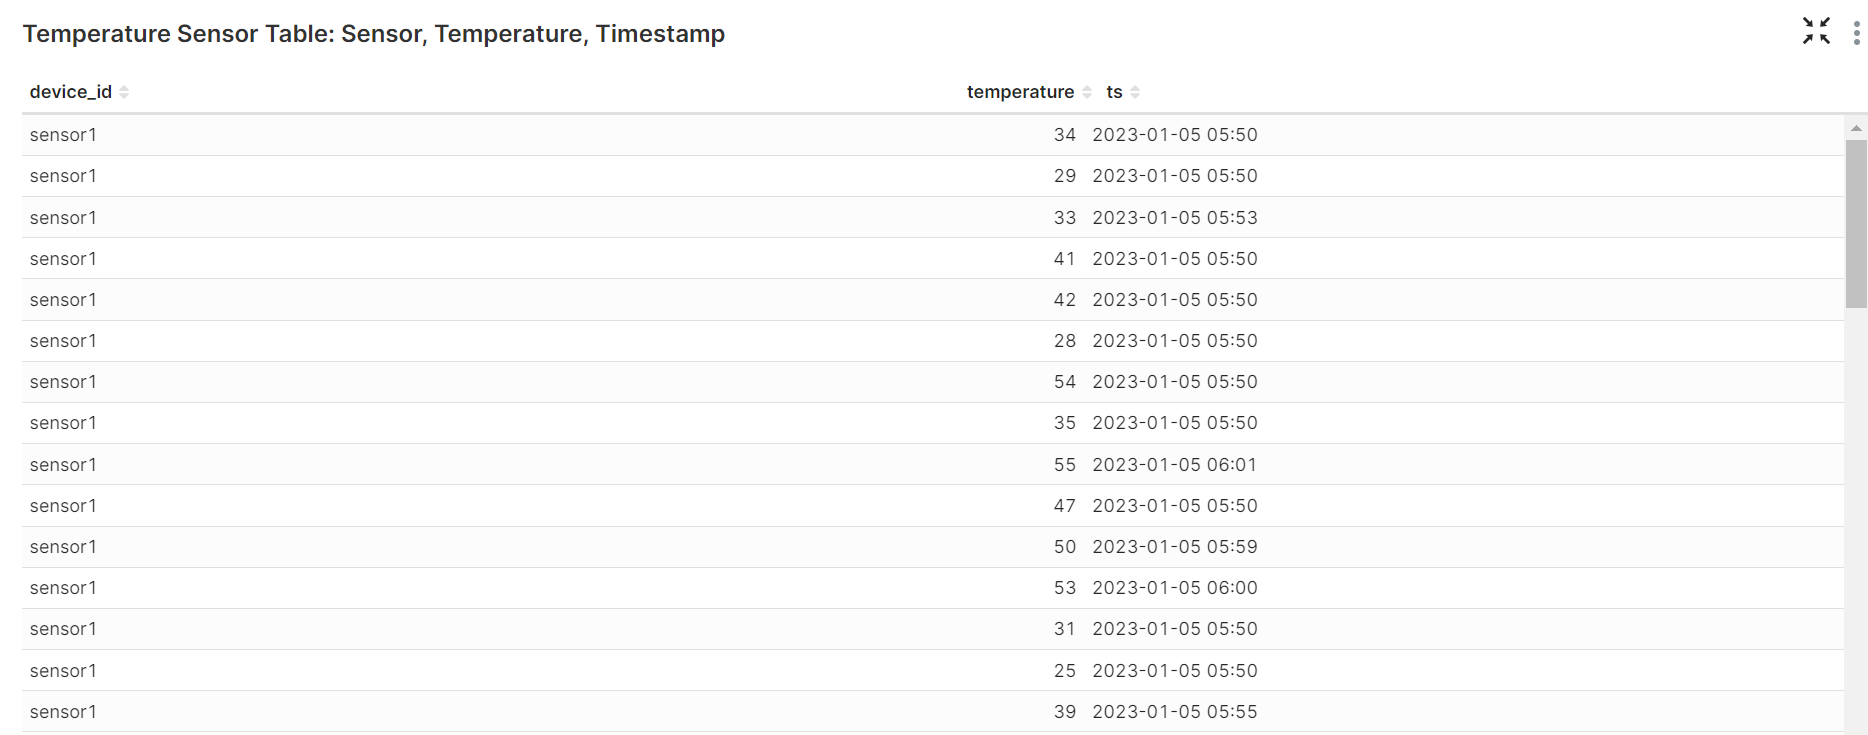
The table below presents temperature information such as the temperature sensor ID, temperature readings, and corresponding timestamps for each reading.
The table below presents humidity information such as the humidity sensor ID, humidity readings, and timestamps associated with each reading.

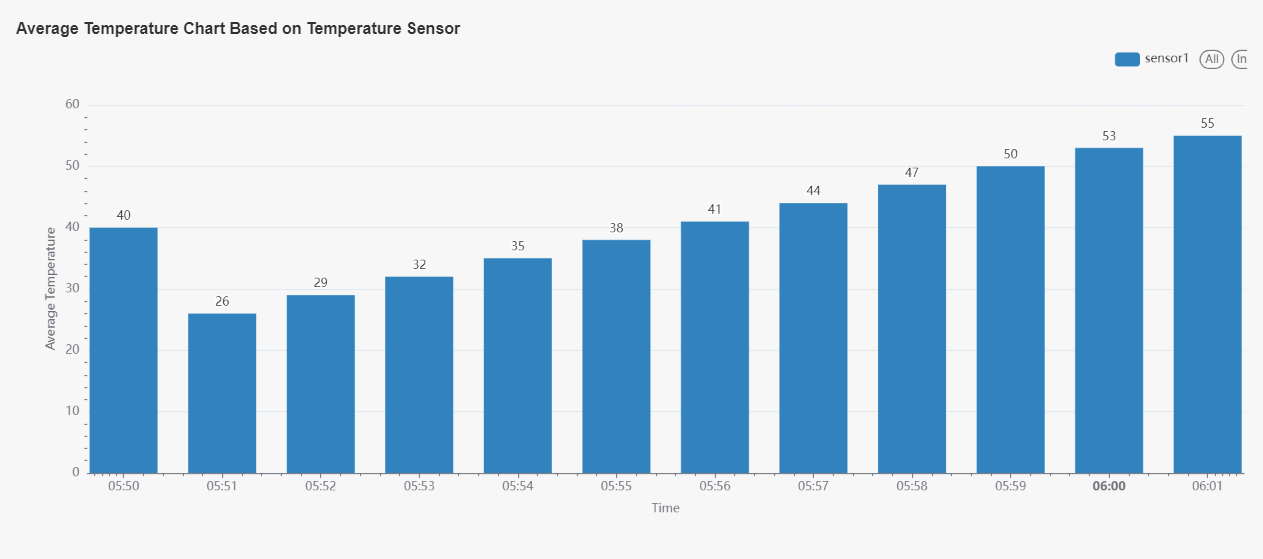
This bar chart is generated from the avg_temperature_mv dataset, showcasing the average temperature derived from temperature sensors within predefined 1-minute time windows.
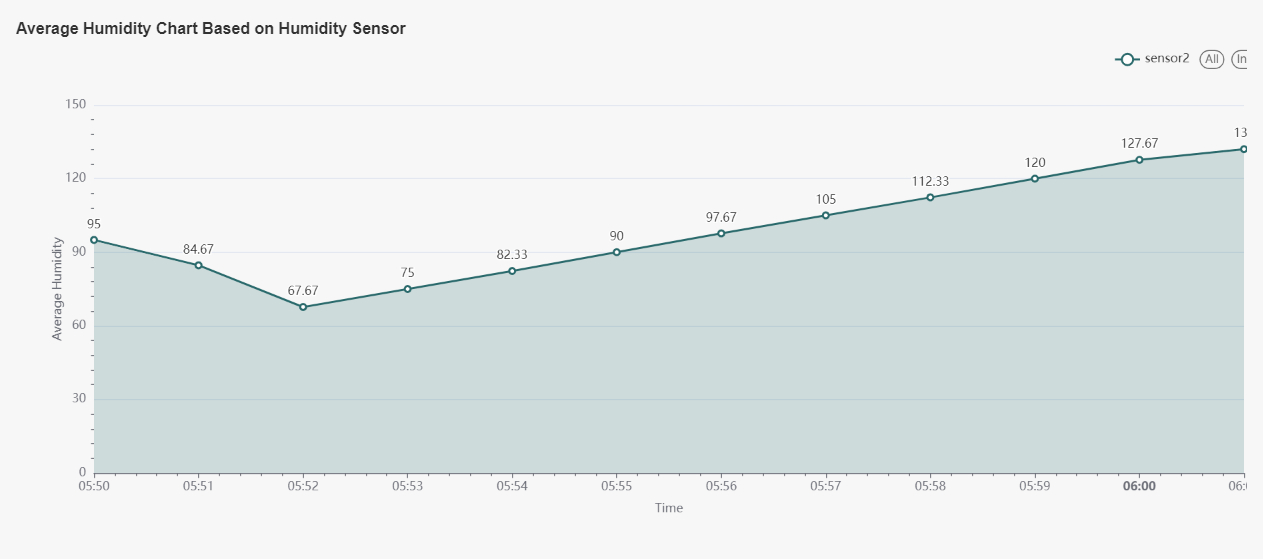
This line chart is generated from the avg_humidity_mv dataset, illustrating the average humidity derived from humidity sensors within specified 1-minute time windows.
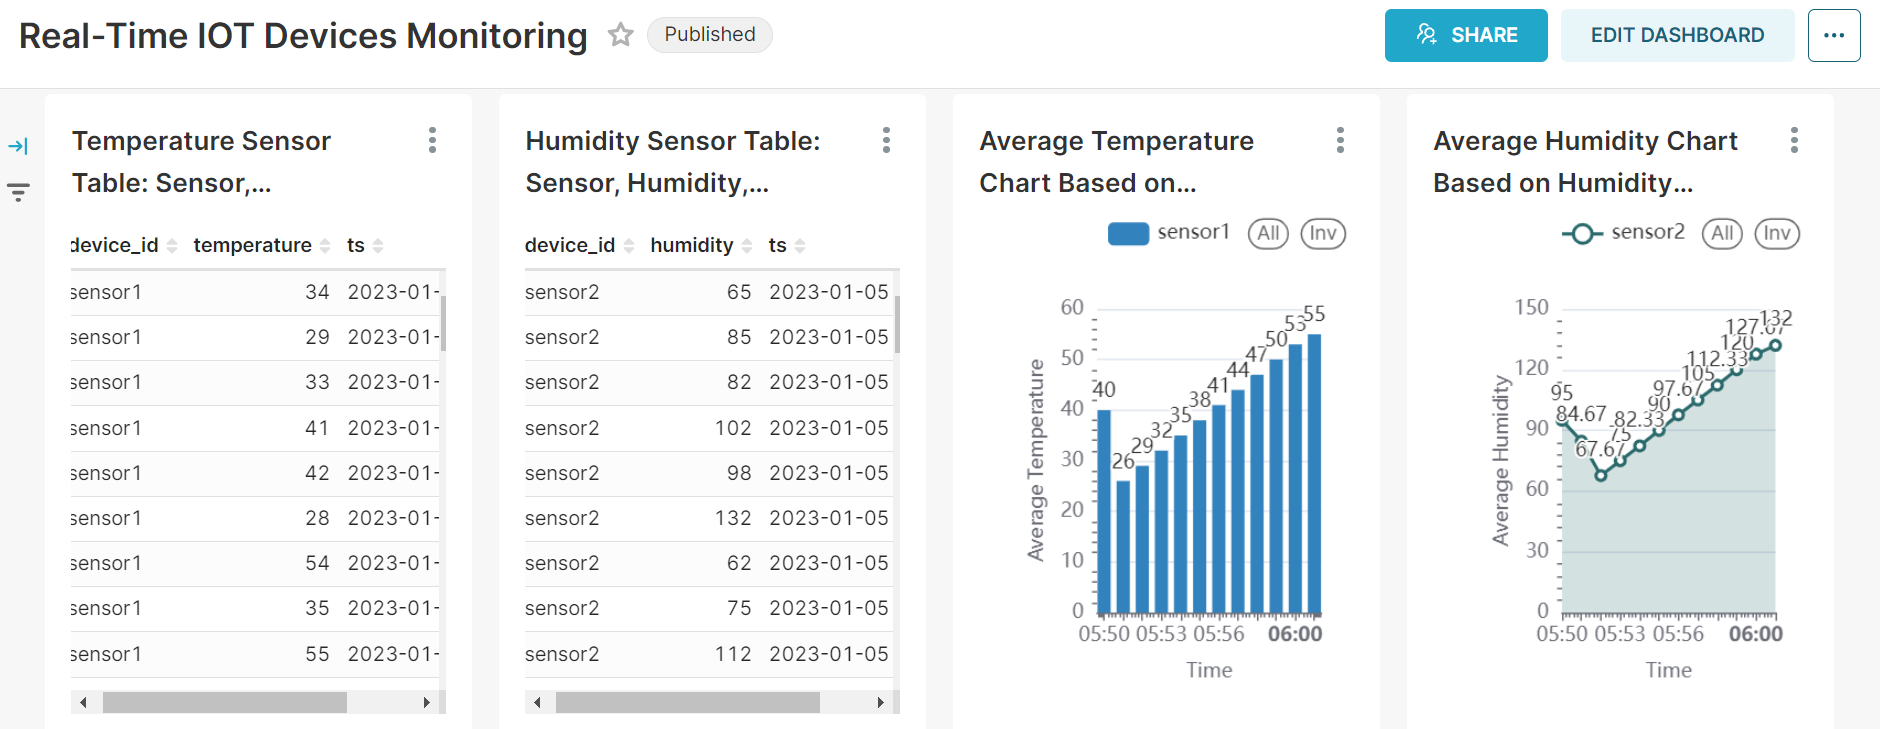
This unified dashboard offers a collection of charts that facilitate comprehensive real-time monitoring of IoT devices. By providing valuable insights into the readings of temperature and humidity sensors at each corresponding timestamp, it empowers users to make informed decisions and effectively monitor industrial IoT devices.
Conclusion
In this blog, we present a step-by-step guide on constructing a real-time IoT monitoring solution by leveraging NATS JetStream, RisingWave, and Superset. With their seamless integration, a real-time IoT dashboard can be created in under an hour.
About the author
Fahad Shah is a developer advocate at RisingWave Labs .
Additional resources
- To stay up to date on the latest developments or view the code, visit the RisingWave GitHub repository - To learn about what’s new about RisingWave, follow RisingWave on Twitter .
- To ask questions about RisingWave, join the RisingWave Slack workspace .
- To have an in-depth understanding of RisingWave, check out the documentation .
Back to Blog